Fun Fall Bar Graphing Lesson with activities for 1st and 2nd grade!
As the leaves change color and pumpkin spice season begins, it’s the perfect time to bring the beauty of fall into a bar graphing lesson! Introducing bar graphs to 1st and 2nd grade students through hands-on activities can make learning both enjoyable and effective.
This fall-themed resource is designed for students who are starting to explore graphs and data.
Here’s a quick overview of what’s included:
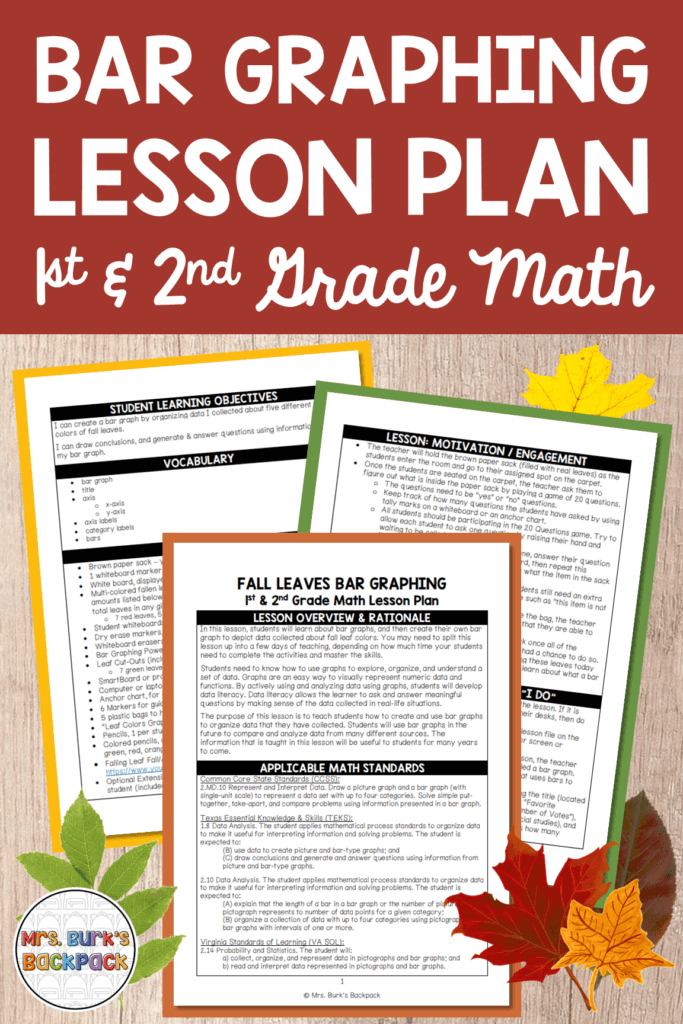
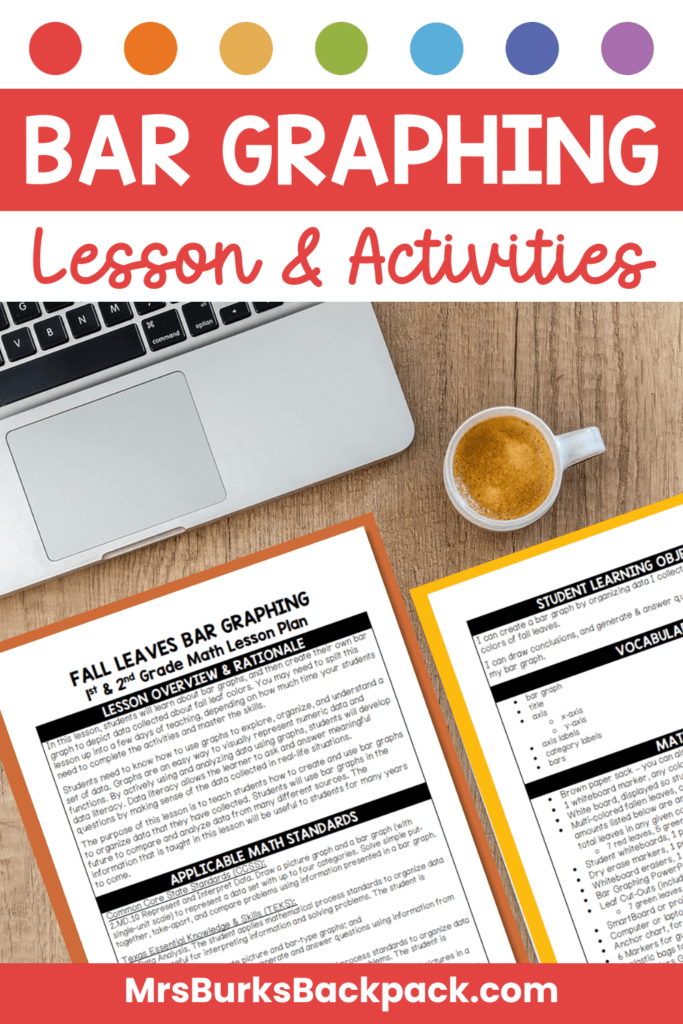
Step-by-Step Lesson Plan: Guides you through the entire teaching process from preparation to assessment with 9 pages of detailed instructions.
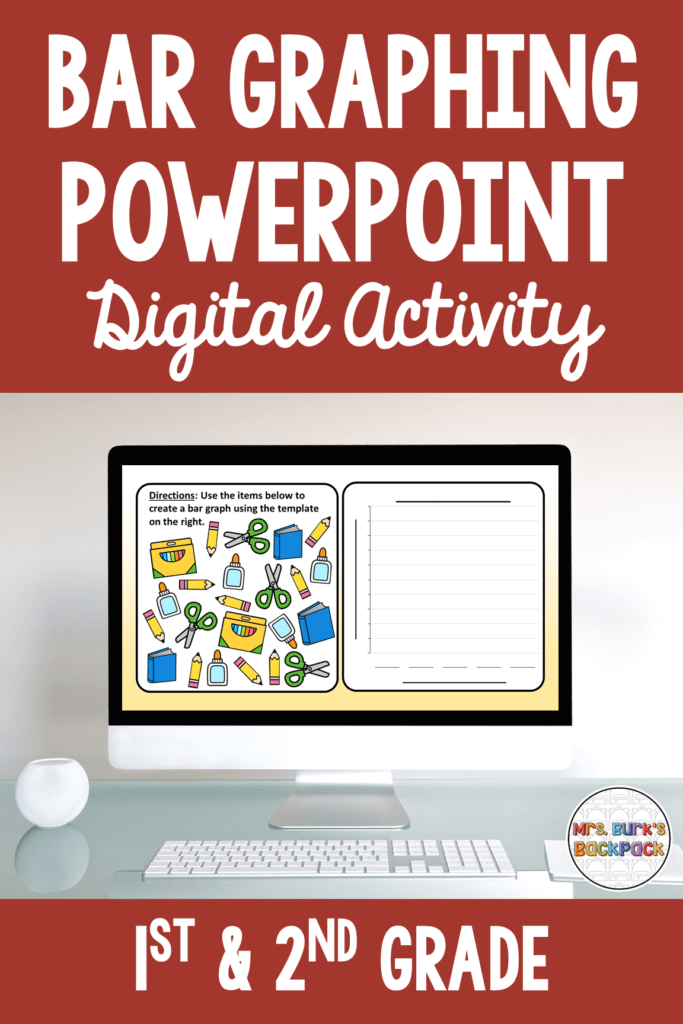
Digital Bar Graphing PowerPoint Activity: Demonstrate how to create a bar graph with these 7 slides!
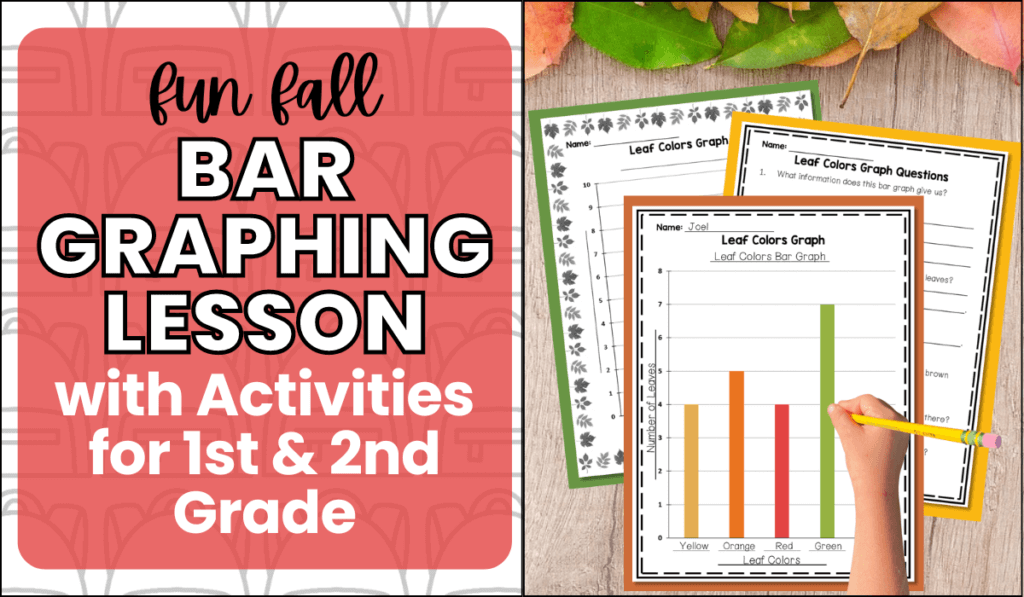
Colorful Leaf Cut-Outs: Bring seasonal excitement to your classroom! Students will first collect data by categorizing fall leaves by color and counting items.
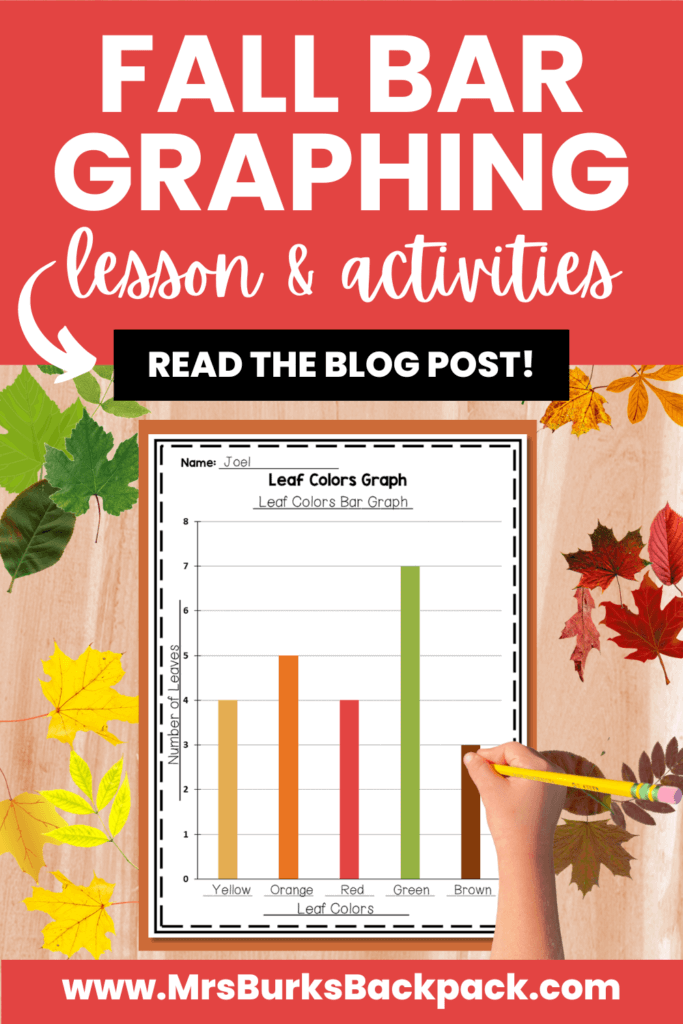
Bar Graph Templates & Questions: Students will then create their own bar graphs using the provided templates, and answer questions about their graphs.
In this lesson, hands-on activities are key to helping students understand bar graphs.
The leaf cut-outs provided serve as manipulatives that students can physically move and organize before plotting their data.
After collecting data by sorting the leaves, students will create their own bar graphs! Using real-world data, like the color of fall leaves, makes the concept of bar graphing tangible and relatable.
This hands-on experience helps students understand the process of creating a bar graph. Additionally, it shows them how data collection and interpretation are relevant in everyday life.
Key Features & Benefits of this Fall Leaves Bar Graphing Lesson Plan
This bar graph lesson plan has many features that will be beneficial for you and your students!
Incorporate Digital Activities: The interactive bar graphing PowerPoint is a simple way to keep students engaged throughout the lesson.
Easily Modify the Lesson: Whether you have English Language Learners (ELLs) or gifted students, this lesson includes ways to meet your diverse students’ needs. Also, the extension activities offer additional challenges for students who are ready to go beyond the basics.
Encourage Critical Thinking:After creating their bar graphs, students are guided to analyze the data, answer questions, and even solve simple addition and subtraction problems using their graphs!
Effectively Assess Understanding: Assessment in this lesson is built into the independent practice activity where students create and analyze their own bar graphs.